
SrTiO3 (001) etching
SrTiO3 (001) etching
The etching speed of step edges was simulated the same way as the etch pit development. The starting images had step edge angles of 0, 15, 30, and 45 degrees, as shown in Fig. 1. The starting image size was 128 x 128 pixels. Etching probability was only changed for straight sites p1. All other sites had their etching probabilities set to 1. This effectively changed the straight site to kink site etching probability ratio.

Fig. 1 Initial step configurations: the step angles are 0, 15, 30, and 45 degrees.
Thus step morphologies of surfaces obtained after a Monte Carlo simulations are shown in Fig. 2.

Fig. 2 Final step configurations.
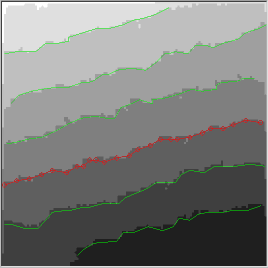
Fig. 3: Averaged step edges marked on a simulation result image.
After simulation, some of the images were used for further analysis. The step edge positions were detected and the distance of each edge from the original position was calculated. A typical image with detected step edges is shown in Fig. 3.
The following table shows the distance how much each step edges moved. The distances were obtained by comparing the initial and final images obtained from the simulation. The positions are scaled by simulation steps (time).
| angle | p(1) | step edge distance | average | ||||||
|---|---|---|---|---|---|---|---|---|---|
| 0 | 0.1 | 21.9429 | 26.9814 | 25.6484 | 25.4748 | 26.7322 | 25.0039 | 25.9773 | 25.3944 |
| 0 | 0.01 | 8.0625 | 8.2884 | 7.6334 | 8.6151 | 8.2042 | 8.2440 | 8.3362 | 8.1977 |
| 0 | 0.001 | 2.6250 | 2.0593 | 2.2370 | 2.5571 | 2.3281 | 2.3776 | 2.1670 | 2.3359 |
| 0 | 0.0001 | 0.6088 | 0.6492 | 0.6287 | 0.4577 | 0.5851 | 0.5857 | 0.4941 | 0.5728 |
| 15 | 0.1 | 26.1660 | 27.8479 | 27.3875 | 26.6967 | 26.2981 | 26.6698 | 26.8443 | |
| 15 | 0.01 | 14.2935 | 14.9279 | 14.9732 | 15.0272 | 14.2381 | 15.7863 | 14.1450 | 14.7702 |
| 15 | 0.001 | 11.7392 | 13.7615 | 12.8702 | 13.6050 | 13.4825 | 15.3411 | 12.9248 | 13.3892 |
| 15 | 0.0001 | 11.9239 | 13.6187 | 13.7880 | 13.5587 | 13.7710 | 15.0201 | 12.6994 | 13.4828 |
| 30 | 0.1 | 32.2489 | 28.6247 | 29.4410 | 27.9324 | 29.1386 | 29.2814 | 28.8890 | 29.3651 |
| 30 | 0.01 | 20.9512 | 20.5174 | 20.5011 | 20.9657 | 20.9164 | 22.0435 | 21.2306 | 21.0180 |
| 30 | 0.001 | 21.9377 | 22.4043 | 19.5154 | 20.4571 | 20.5773 | 20.3992 | 21.1453 | 20.9195 |
| 30 | 0.0001 | 20.4384 | 20.9713 | 19.5677 | 20.7928 | 20.3855 | 20.9407 | 21.0193 | 20.5880 |
| 45 | 0.1 | 26.8701 | 32.6394 | 29.5323 | 29.6501 | 30.1106 | 30.7656 | 28.9832 | 29.7930 |
| 45 | 0.05 | 25.4558 | 27.1731 | 26.6674 | 25.9429 | 26.0109 | 25.4734 | 25.8082 | 26.0760 |
| 45 | 0.01 | 24.3952 | 23.8884 | 23.8324 | 21.3961 | 23.0715 | 22.9010 | 22.9643 | 23.2070 |
| 45 | 0.001 | 21.9203 | 24.3176 | 23.2743 | 22.1668 | 22.9344 | 23.8601 | 24.1047 | 23.2255 |
| 45 | 0.0001 | 23.1774 | 24.7460 | 23.8568 | 22.4493 | 22.6969 | 22.9944 | 24.3146 | 23.4622 |
It is interesting to compare these reuslts with the etch pit etching speeds. The simulation image size was different, but the pit etching results can be scaled to give comparable edge movement speeds:
| p(1) | pit edge speed | scaled pit edge speed |
|---|---|---|
| 0.1 | 6.1735 | 24.6939 |
| 0.05 | 4.4034 | 17.6136 |
| 0.01 | 2.0217 | 8.0868 |
| 0.001 | 0.5363 | 2.1452 |
| 0.0001 | 0.1421 | 0.5684 |
What we would expect is that the step edge etching speed is (sin(a)+cos(a)) times faster than the etch pit edge etching speed, where a is the step edge angle. The etch pit is, of course, aligned with the crystallographic axes (the 0 degree direction). The following table shows the ratios of simulated step edge etching speeds and pit etching speeds for various angles, together with the straight edge site etching probabilities p1.
| Angle | sin(a)+cos(a) | p(1)=0.1 | p(1)=0.05 | p(1)=0.01 | p(1)=0.001 | p(1)=0.0001 |
|---|---|---|---|---|---|---|
| 0 | 1.000 | 1.028 | 1.014 | 1.089 | 1.008 | |
| 15 | 1.225 | 1.087 | 1.826 | 6.241 | 23.721 | |
| 30 | 1.366 | 1.189 | 2.599 | 9.752 | 36.221 | |
| 45 | 1.414 | 1.206 | 1.480 | 2.870 | 10.827 | 41.278 |
What this table shows is that for a probability ratio of p1/p2=0.1 the simulated step edge movement speed is lower than the scaled etch pit edge movement speed. For this p1/p2 ratio, the step etching rate is too low. The difference is most clearly visible for the 45 degree step orientation.
On the other hand, the step edge etching is too fast for a p1/p2 ratio of 0.01. A suitable value appears to be somewhere in between, at around a ratio of 0.05. In other words, it appears that to obtain consistent step edge and pit edge etching ratios, the etching of a straight edge site should be about 16 times less likely than the etching of a kink site.
This value (16) also shows why the in situ etching AFM observation only shows linear etch pit growth. This happens because for a relatively small p1/p2 ratio the quadratic growth region ends very quickly, before the etch pit shapes becomes observable by AFM (on the order of 20 to 50 unit cells).
An interesting question is the influence of pH on the etching probabilities. A change in pH can, presumably, change the p1/p2 etching ratio and therefore cause the surface to become more wavy or more faceted. This is indeed observed in actual etched surfaces.