
SrTiO3 (001) etching
SrTiO3 (001) etching
These simulation address the BHF etching process of SrTiO3 (001) substrates. It is known that the etching can produce either faceted or meandering substrate step edges, depending on the etchant pH. Real-time in situ AFM measurements of the etching process are the basis for the simulations.[1]
The simulation starts with a realistic SrTiO3 surface. The dynamic 'unit' is assumed to be a unit cell. This is not an atomic-scale simulation, it only deals with intact unit cells. This model can be justified by noting that neither AFM nor STM images of SrTiO3 surfaces ever show half unit cell steps on the STO surface. This applies to both etched and in situ annealed surfaces.
The simulation world size is limited by the available memory and run time. Each pixel in the input image corresponds to a unit cell. Realistic image sizes are thus approximately 1000 × 1000 unit cells, or 400 nm × 400 nm. Maximum simulation size is around 4000 × 4000 unit cells. This size should be large enough to accommodate etch pits and still avoid 'edge effects', caused by the disturbing influence of the simulation world edges.
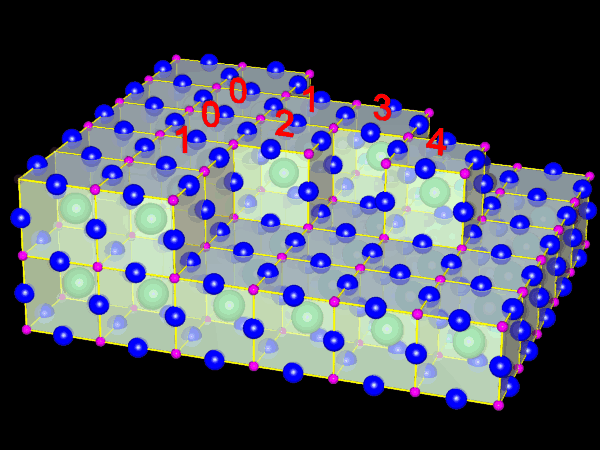
Fig. 1: Unit cells of the etching model. The free edge counts are shown for typical unit cell types.
Each unit cell in the model is assigned a probability of being removed from the surface during the etching process. This probability is assumed to be proportional to the number of free unit cell edges. This number ranges from 0 for a unit cell completely surrounded by neighboring cells to 4 for a completely isolated unit cell in the middle of a terrace.
Probabilities must next be assigned to each possible configuration. When counting free edges, the number of configurations is 5, corresponding to the free edge count that ranges from 0 to 4. As Fig. 1 shows, it is possible to make kink sites (free edge count 2 or 3) less stable than sites in straight terrace edges (count 1). It is probably sensible to assign the lowest stability to isolated unit cells with a free edge count of 4 and the highest stability to completely surrounded cells with no free edges. This way lone cells are not left on the surface and new etch pits cannot be created during the simulation.
During a simulation, the computer picks a random unit cell on the substrate surface. The number of free edges of this unit cell are counted and an index ranging from 0 to 4 is obtained. Another random number is now picked, in the range 0 to 1 and compared to the probability assigned to a particular free edge index. If, for example, a particular unit cell has 2 free edges and the probability assigned to index 2 is, say, 0.1, then there is a 10% chance of removing this particular unit cell eatch time the computer tries it.
A large number (depending on the simulation world size) of unit cells are tested in this way and some are etched (removed from the surface). Usual numbers range from 105 tries for a small simulation to 108 tries for a large simulation. A series of such snapshots can be generated and these can be converted into an animation that shows how the etching process proceeds. It is also possible to use these snapshots to determine the rates at which step edges move.
An example starting image is in Fig. 2:
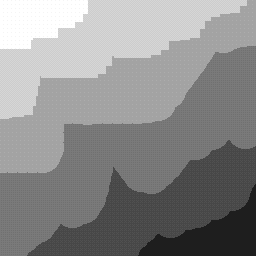
Fig. 2 Step configuration at the start of an etching simulation
Depending on the relative stabilities of the straight edges (1 free edge) and kink sites (2 or 3 free edges) this surface can obtain either a faceted structure (Fig. 3) or a meandering step edge structure (Fig. 4).
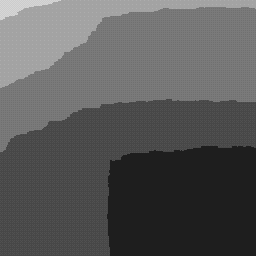
Fig. 3 Simulation result with stable edges, unstable islands.
QuickTime animation (300kB)
Fig. 4 Simulation result with metastable islands.
QuickTime animation (1MB)