
Walkman PLD
Walkman PLD
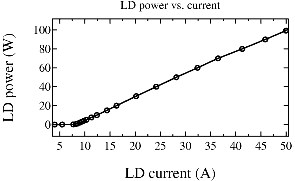
Fig. 1: Diode laser output power vs. drive current.
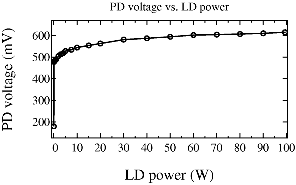
Fig. 2: Photodiode output voltage vs. diode power.
The output power of the laser was measured with the fiber and focusing optics attached. The laser threshold is around 9 A feed current and the output power increases linearly with drive current (Fig. 1). Temperature control by PID is thus relatively easy, except for the range very close to the laser threshold.
The laser head also includes a monitoring photodiode. Unfortunately this is mostly an on/off sensor that doesn't have a linear power response (Fig. 2). This is unfortunate, because a calibrated linear sensor would help to monitor the health of the laser and the integrity of the optical path from the laser head to the sample. The photodiode voltage/power curves were input to the control program, mostly for monitoring purposes.
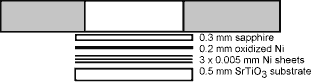
Fig. 3: Sample mounting for high-temperature operation.
The sample was mounted using the 'high-temperature' mounting geometry, as shown in Fig. 3. The sample is thermally isolated from the sample holder with a 0.3 mm sapphire sheet. The heating laser light passes through the sapphire and a hole in the sample holder. The infrared laser Light is absorbed by a 0.2 mm Ni sheet. The Ni sheet is oxidized in air in a furnace and is covered with a dark green oxide layer. Three 5 μm Ni sheets are placed between the thicker Ni sheet and the STO substrate to obtain a good thermal contact. Other metal sheets can also be used, depending on the maximum operating temperature. Ni sheets can be used up to about 1400°C.
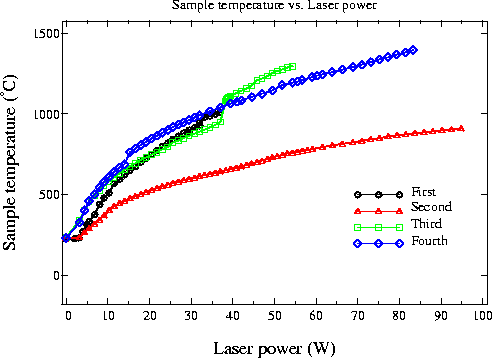
Fig. 4: Measured substrate temperature during four heating runs at different heating laser beam sizes.
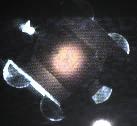
Fig. 5: Focused laser spot, thin absorber
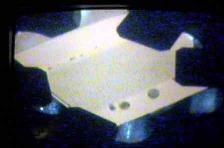
Fig. 6: SrTiO3 substrate being annealed at 950°C
Four heating experiments were performed. The summary is shown in Fig. 4.