
SrTiO3
SrTiO3
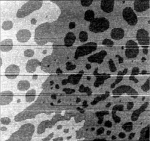
Fig. 1: STM after 900°C anneal, 300 × 300 nm2.
After a 10-minute anneal at 900°C, an image taken at 800°C (Fig. 1) shows atomically flat terraces starting to appear. A wide-area image shows mostly continuous terraces with large holes still remaining on the surface. Two important processes occur at this temperature. The surface morphology continues to evolve towards the perfect step-and-terrace structure. Over time, the remaining holes fill up and the step edges tend to become straighter. Besides the morphology change, the surface composition also keeps changes. Besides oxygen loss, SrTiO3 suffers from spontaneous formation of Sr vacancies and the segregation of Sr on the crystal surface. The Sr segregation can be avoided by reducing the oxygen pressure during annealing and decreasing the annealing time.
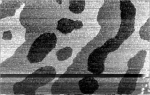
Fig. 2: STM after 1000°C, imaged at 600°C, 300 nm × 180 nm.
The morphology change is quite rapid. This can be seen in the change of hole size and shape after a brief anneal at 1000°C (Fig. 2). For atomic-scale structure analysis, there should be little difference between this surface and a fully annealed surface with completely parallel steps and uniform terraces, except that longer annealing also increases the amount of segregated Sr on the surface. The surface preparation is thus a compromise between perfect morphology and atomically well-ordered TiO2 terminating layer.
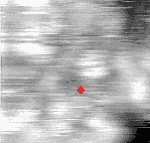
Fig. 3: STM after 10-minute 900°C anneal, 10 × 10 nm2.
A close-up view of a terrace shows a generally disordered surface (Fig. 3) with small bumps having a diameter of 2 to 4 unit cells. The apparent height of the corrugations is well below the height of a unit cell. A single unit cell size is shown in red in the middle of Fig. 3 with a red square. The red marker also shows the orientation of the crystal [100] and [010] axes. Although the STM image does not show atomic order on the surface, RHEED does show a variety of reconstructions. The most common is a 2×2 pattern, but 4×4, 5×5, and even 6×6 reconstructions appear ater annealing at around 1000°C. Most of these reconstructions appear to be related to segregated Sr on the surface.
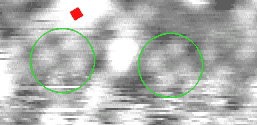
Fig. 4: 10 nm × 5 nm, 800°C.
Some places on the terraces start to show ordered structures. A unit cell shape is shown in red in Fig. 4 and the possibly ordered surface structures are marked with greed circles. Since the ordered structures appear to be approximately 4 unit cells wide, it is likely that these structures are related to ordering of the surface Sr. Despite these visible surface structures, the RHEED images still show essentially 1×1 SrTiO3 patterns with only weak reconstruction features.
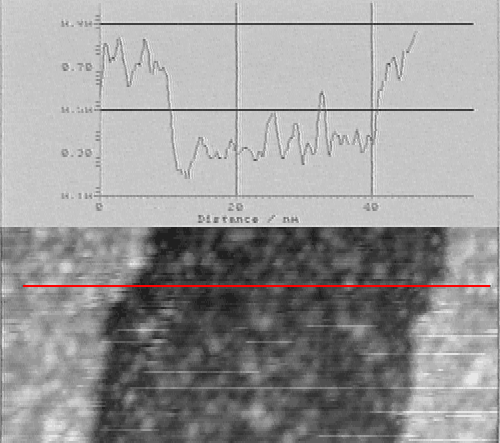
Fig. 5: Cross section of a terrace
A surface profile plot shows that all features on the terraces are much lower than a single unit cell height. The 0.4 nm, single unit cell step edges are clearly much higher than the corrugations within a terrace. The maximum height of the bumps on the terraces are about 0.1 nm according to the STM profile.
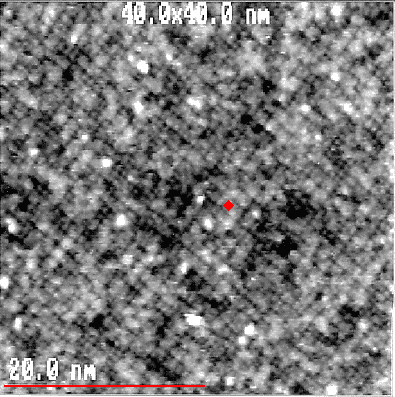
Fig. 6: Ordered 2×2 surface
A relatively well-ordered surface can be seen after annealing a crystal for several hours in UHV at approximately 600°C. The RHEED pattern of this surface shows strong 2×2 streaks. A 2×2 unit cell block (shown in red in Fig. 6) appears to be the quite common on this surface. The low annealing temperature is important because it prevents additional Sr segregation from the bulk of the crystal while the long annealing time is needed for the sgregated Sr to aggregate into macroscopic islands, leaving most of the terraces nearly clean.