SrTiO3
SrTiO3
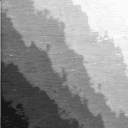
Fig. 1: As-supplied wet-etched SrTiO3 AFM image
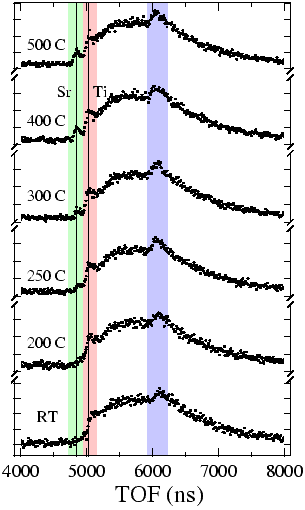
Fig. 2: Temperature dependence of Sr segregation. CAICISS TOF peaks: Sr (green), Ti (red), O (blue).
The two important things that we look at are the surface morphology (AFM or STM), and the terminating atomic layer composition (CAICISS). The AFM image in Fig. 1 shows a rather typical as-received wet-etched SrTiO3 surface. The terrace width depends on the miscut angle and is about 230 nm in this case.
CAICISS measurements at room temperature or up to about 250°C show only a Ti peak along the 111 direction He-ion scattering (Fig. 2), which means that the surface is terminated only by the TiO2 layer. Upn heating, a Sr peak starts to appear at above 250°C and remains constant at 500°C and above. The peak intensity corresponds to a Sr coverage of about 15%. This means that the wet-etched SrTiO3 surface is not stable at high temperature and Sr segregation will always occur when the substrate is heated to typical thin film growth temperatures.
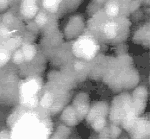
Fig. 3: SrTiO3 STM, 25 × 25 nm2
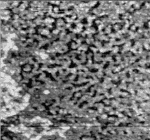
Fig. 4: SrTiO3 STM, 100 × 100 nm2
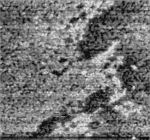
Fig. 5: SrTiO3 STM, 200 × 200 nm2
These images were taken at room temperature after keeping a substrate at 550°C for several hours. Unit cell layers can still be seen (black, gray and white in Fig. 4, but the terraces are broken into meandering islands. It is hard to identify where the 'step edges' are. This breakup coincides with the increase of Sr detected by CAICISS. Despite the breakup of the surface in the lateral direction, all the steps and small islands still have a uniform height of a single STO unit cell. On a finer, 25 nm scale, the island structure is clearly visible. These islands have a diameter of 5 to 10 unit cells (2 to 4 nm). High-temperature annealing is therefore necessar to recover continuous terraces before deposition.
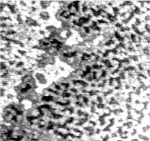
Fig. 6: SrTiO3 STM at 600°C, 100 × 100 nm2
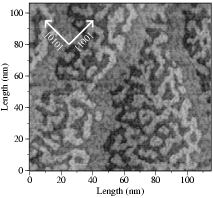
Fig. 7: SrTiO3 STM at 635°C, 110 × 110 nm2
The surface continues to evolve at higher temperatures. Smaller islands start to combine with neighboring islands, forming terraces that still have many holes. Interestingly, the first feature to form is a continuous step edge. This may indicate that surface atom diffusion along a step edge is faster than across a terrace. This would explain why holes in a lower layer are rapidly filled close to a step edge in the upper layer. The surface migration behavior shows no indication of diffusin barriers occurring on step edges and material from higher layers feeds the filling of holes in the lower layers.
The surface morphology changes dramatically when the temperature is between 600 and 700°C. Uniform terraces start to reappear and the island size increases. Some of the local island edges appear to follow the [100] or [010] directions marged with white arrows in Fig. 7. Despite the faceting, the average step edge direction is still determined by the miscut direction.
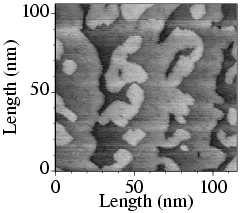
Fig. 8: SrTiO3 STM at 700°C, 110 × 110 nm2
Step edge movement starts to be clearly visible at around 700°C and can be followed in real time by high-temperature STM. Small holes are no longer present on the terraces. Only larger features remain, but even the remaining holes are gradually being filled by atoms migratng on the terraces. The migration rate at 700°C is fast enough to be directly imaged by high-temperature STM.
A SrTiO3 substrate was heated in small steps of 10 to 20°C at a time. The temperature was allowed to stabilize for about a minute and a series of scans was taken at each temperature step. The animations were produced by cutting regions from the STM scans and aligning them with each other. This way the thermal drift of the imaging area could be compensated. Unfortunately this also reduced the size of the images. Animations are available in both AVI and QuickTime formats.
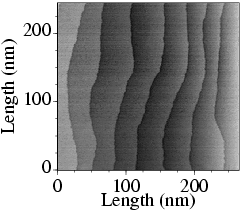
Fig. 9: SrTiO3 STM at 800°C, 240 × 240 nm2
Perfectly straight step edges are finally back! The terrace width of this substrate was fairly small, around 25 nm. For wider terraces either the heating time must be much longer or the temperature higher. For substrates that have no intentional miscut, the terrace width can be very large, requiring ~2h annealing times, for a 0.2° miscut substrate 15 minutes at 950°C seems to do the trick. At these temperatures the step edges move very fast. The last anymation shows a particle on the surface, pinning the step edge. The step edge can shift by more than a nm between frames (10 seconds). The edge oscillates around its equilibrium position, which shows that the movement is not caused by evaporation, but by rapid surface diffusion.