SrTiO3 (001) etching
SrTiO3 (001) etching
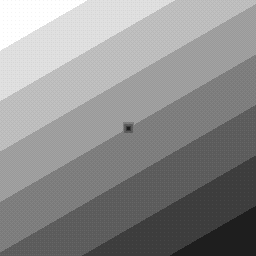
Fig. 1: Starting image for all pit shape simulations
The same starting image (Fig. 1) was used for all etch pit sape simulations. The terrace edges of the starting surface were rotated 30 degrees from the crystal axes. An etch pit was placed at the center of the surface.
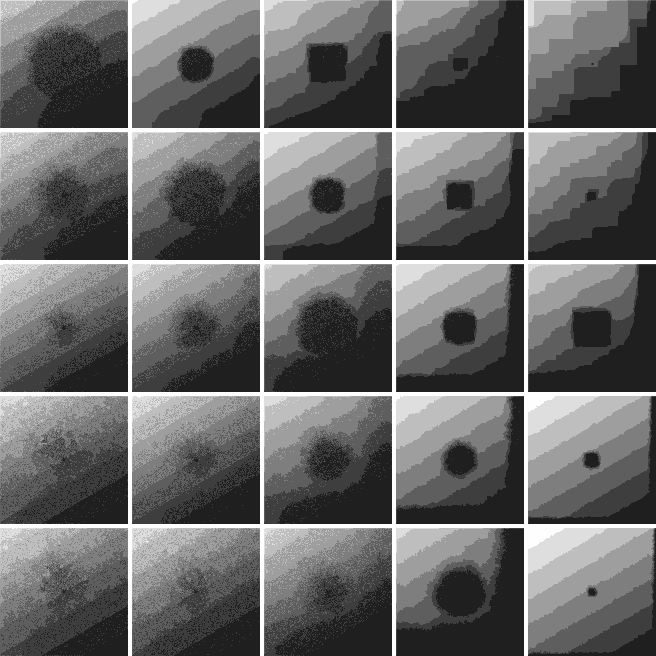
Etching probabilities were chosen so that new etch pits could not form (p(0)=0) and isolated unit cells were always removed (p(4)=1). Other etching probabilities were varied in the range 1 to 0.0001. The simulation results are shown in the following tables.
The simulation parameters for each case can be seen at the top of the table when you position the mouse cursor over an image. A small animation of the etching process can be seen by clicking on an image in the tables.
p1=1, p2=0.01, p3=1
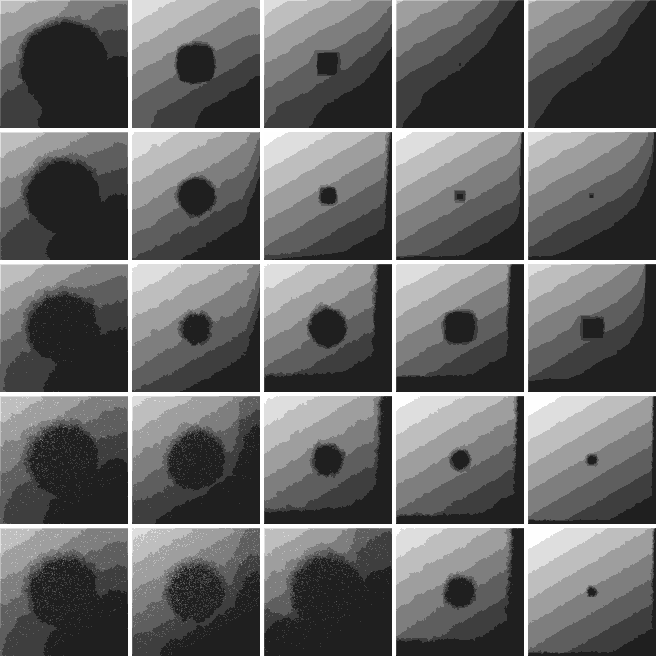
p1=1, p2=0.01, p3=.1
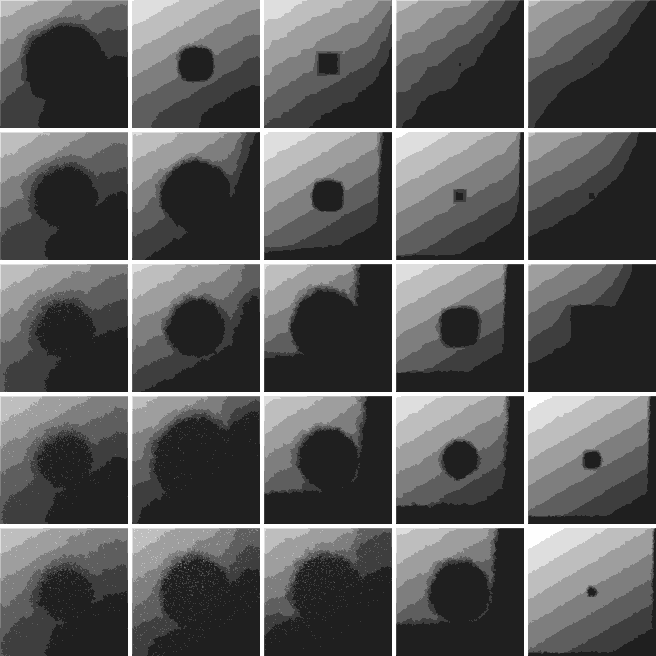
p1=1, p2=0.01, p3=.01
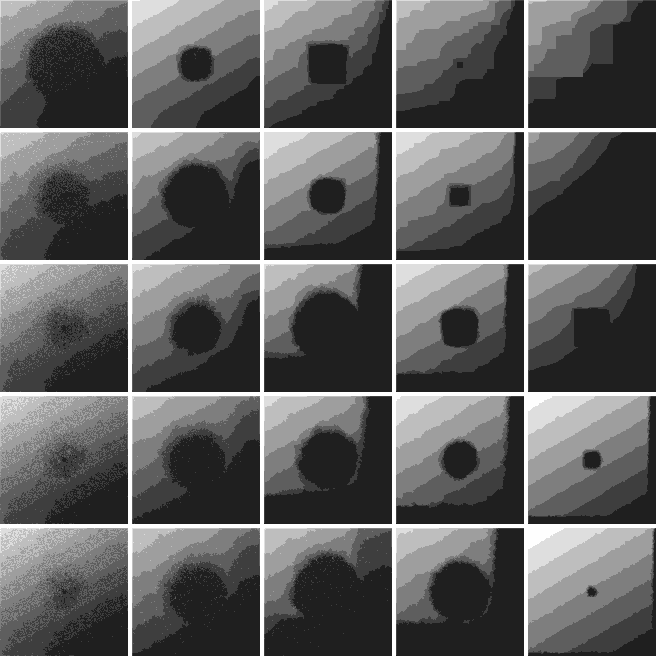
p1=1, p2=0.01, p3=.001
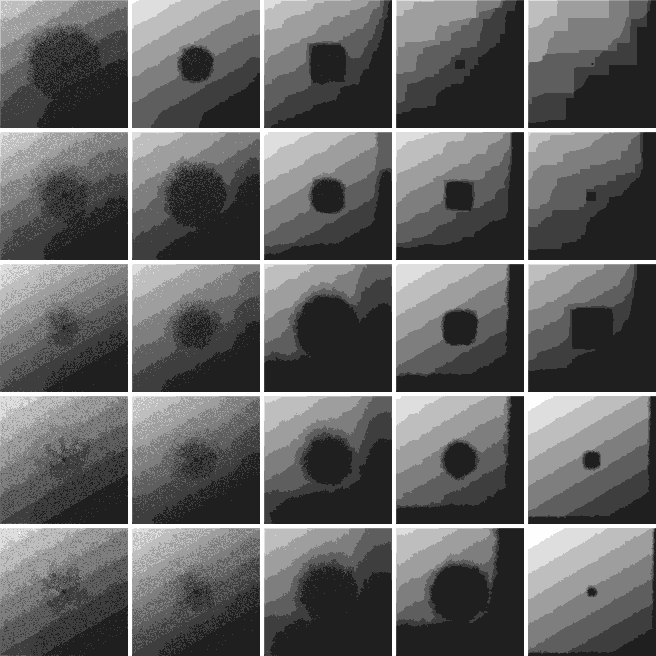
p1=1, p2=0.01, p3=.0001